#endpoint-forensics #MemProcFS #VirusTotal #EvtxECmd #TimelineExplorer #ZimmermanTools #cyberdefender-medium #finished #reviewed #CyberDefenders #CyberSecurity #BlueYard #BlueTeam #InfoSec #SOC #SOCAnalyst #DFIR #CCD #CyberDefender
Scenario
As a member of the DFIR team at SecuTech, you’re tasked with investigating a security breach affecting multiple endpoints across the organization. Alerts from different systems suggest the breach may have spread via removable devices. You’ve been provided with a memory image from one of the compromised machines. Your objective is to analyze the memory for signs of malware propagation, trace the infection’s source, and identify suspicious activity to assess the full extent of the breach and inform the response strategy.
Investigation
Quick Memory Triage
Let’s first perform a memory triage just to get our bearings.
Windows Info
Let’s first check the basic info of the memory dump.
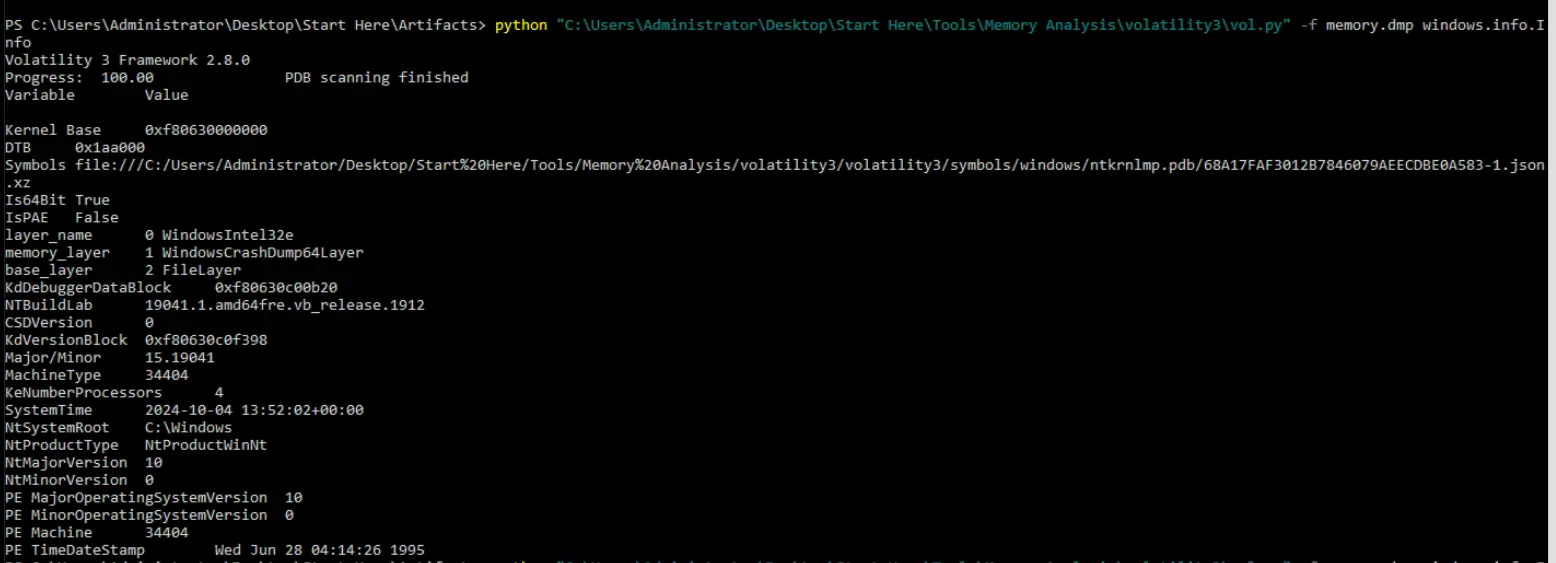
windows.info.Info output
We can see the Windows version is Windows 10 and the system clock was at 2024-10-04 13:52 UTC.
Also note that this is a .dmp file meaning it’s a Windows crash dump.
Pslist
Let’s now output the pslist into a file and see if we can find anything interesting.
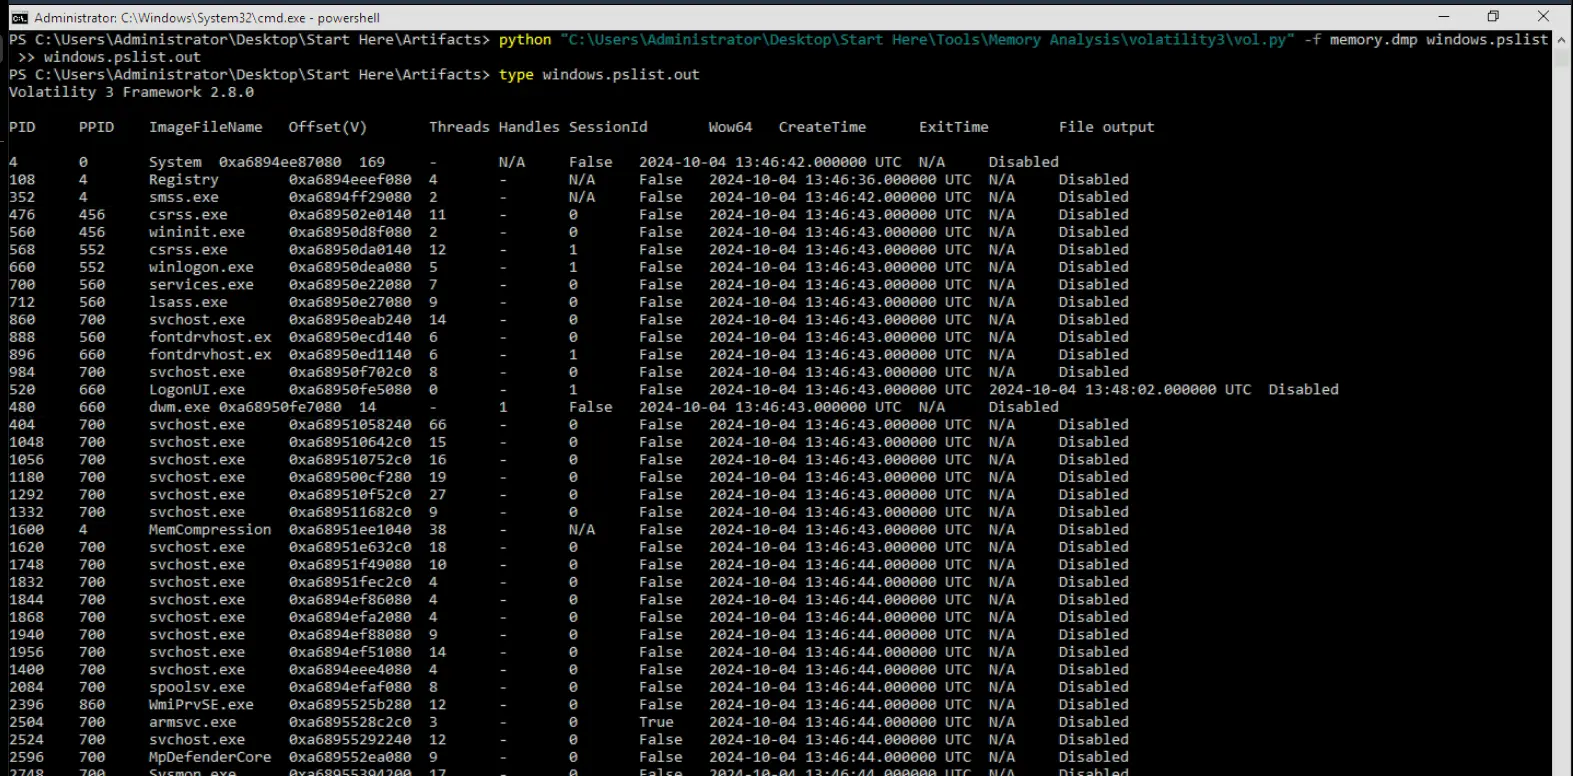
Output pslist into windows.pslist.out
Let’s search for the following using sls
cmd.exepowershell.exeThe intuition is that I am trying to find any suspicious parent child relationship with these processes.

Searching for PowerShell and cmd
We can see that cmd was spawned by 5028.
We can also see that PowerShell was spawned by the cmd processes.
If we search for the parent of the cmd process we will find that the process is explorer.exe.
As seen below.
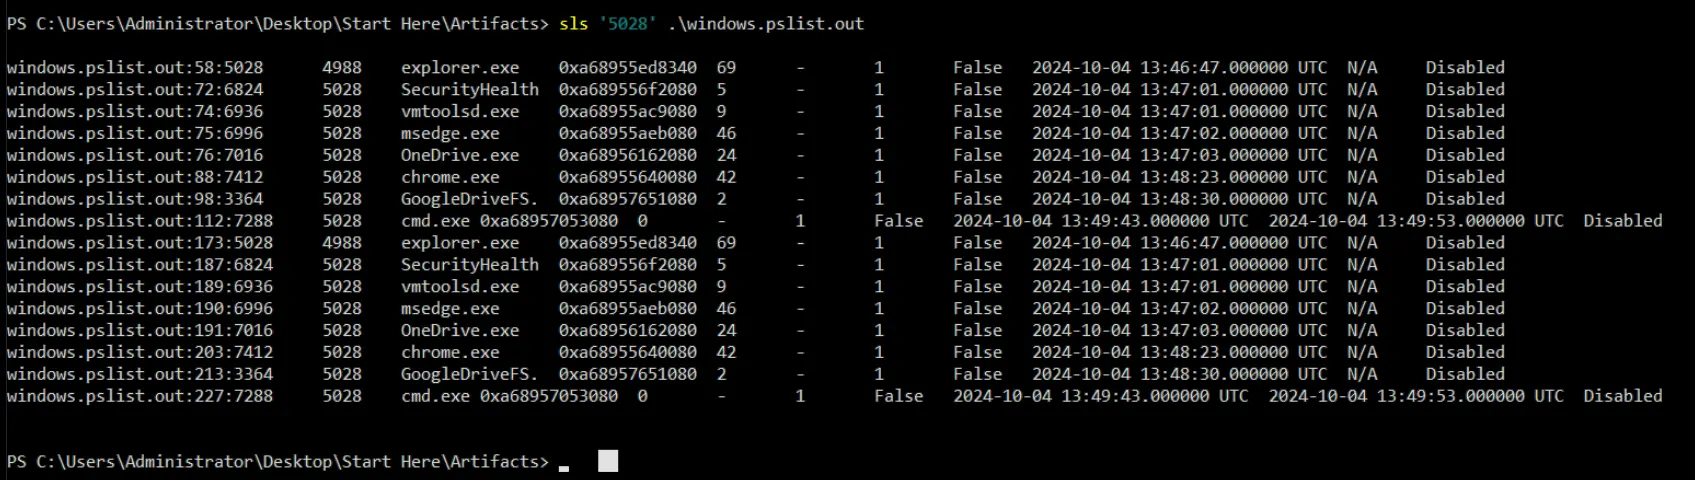
Finding pid 5028
Cmdline
Let’s output the cmdline into a file and see if we can find clues on how PowerShell or cmd was invoked and with arguments.
We can also check this output for other interesting artifacts like odd files executing in temp directories or other suspicious locations.

Creating windows.cmdline.out
If we sls for explorer.exe, cmd.exe and powershell.exe we will see the following,
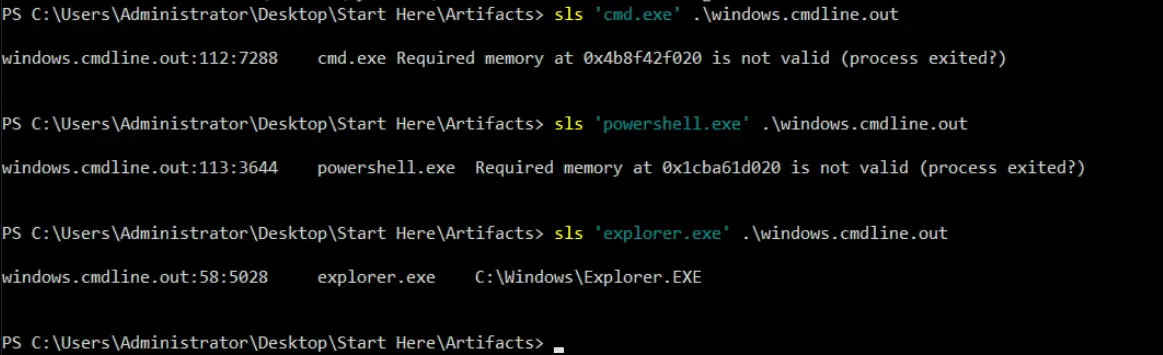
Output of sls for processes
We cannot find anything useful from the cmdline but now we know that both cmd and PowerShell ran and exited cleanly.
We can however find a username from the dump by sls 'appdata' .\windows.cmdline.out.
Which gives us Tomy as well as some really long output from chrome.exe as seen below,
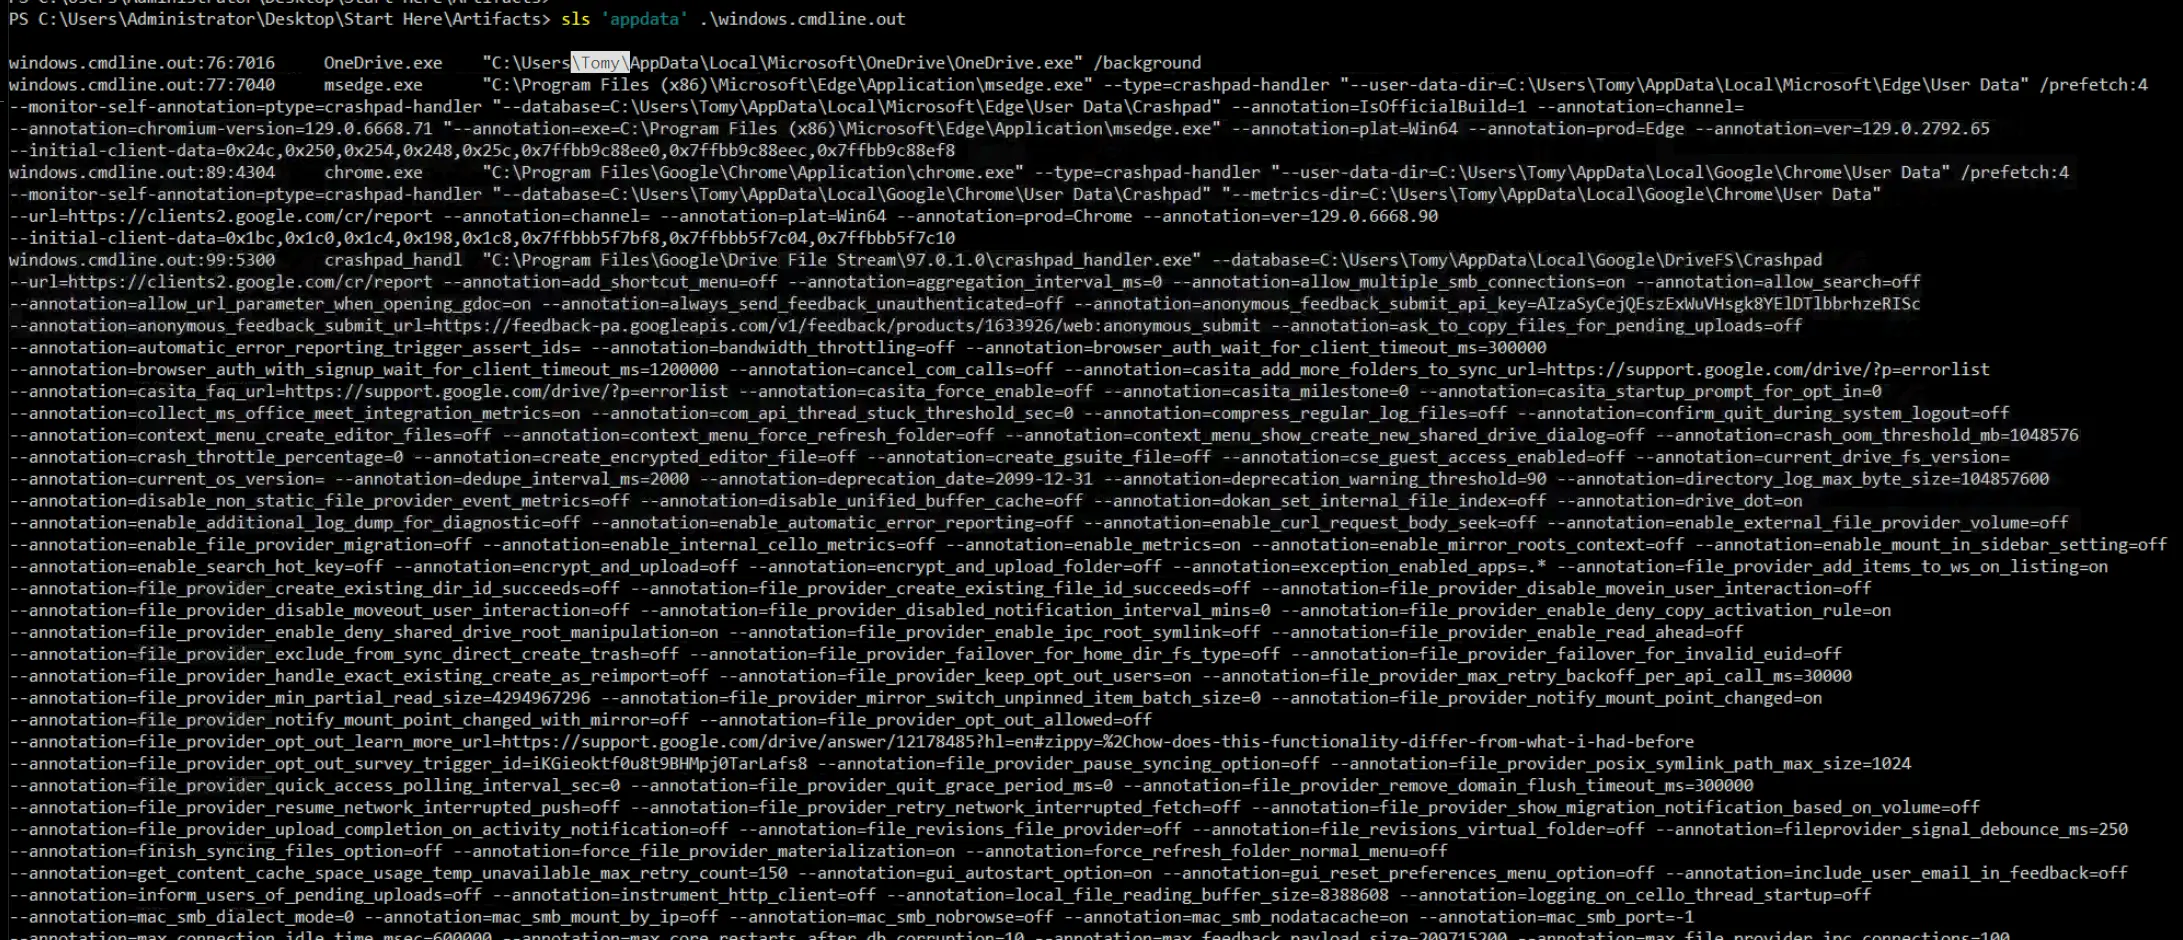
sls appdata output
Netscan
We are not getting much back from pslist and cmdline but perhaps we can find some evidence of callbacks to the C2 that we can identify.
Let’s also look at netscan to see if anything of interest was captured.
First we run the following command.

Creating windows.netscan.out
Then we just sls the following terms
ESTABLISHED-> actively talking at point of dumpLISTENING-> Processes waiting for connectionsCLOSE_WAIT-> Recently terminated connections
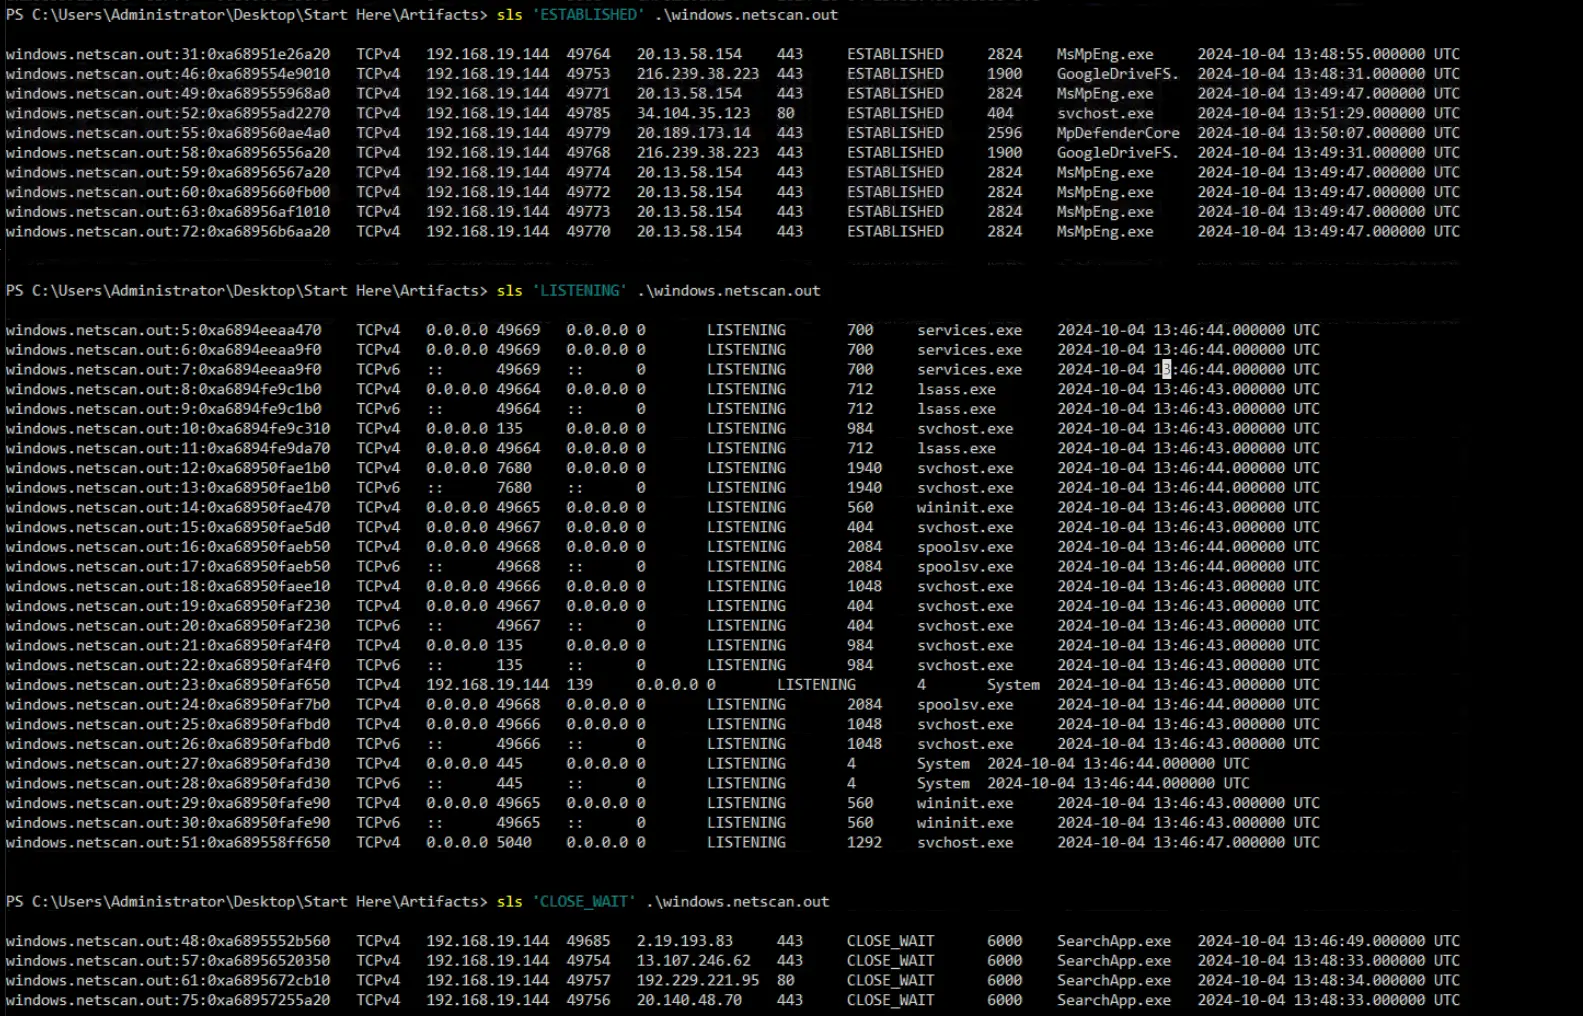
Output of sls
There are some potential connections which might be suspicious as they occur over unencrypted channels, for instance
SearchApp.exerecently closed connection to13.107.246.62over port80which is not encrypted.svchost.execonnected successfully to34.104.35.123over port80which is also not encrypted
Researching into the SearchApp.exe connection to 13.107.246.62 reveals that while it was over an unencrypted channel, it is actually just a connection to the Microsoft and Azure CDN IP address range.
On the other hand, there are ~13800 community entries about 34.104.35.123 stating that this IP was referenced as part of a botnet and has a community score of -4.
However, all security vendors on VirusTotal did not flag this IP and some community members state that it is a benign update service.
This disagreement between community reports and vendor verdicts means we cannot rule it out.
Concluding Triage
Initial triage of pslist, cmdline and netscan didn’t give us anything concrete — just a suspicious process chain in explorer.exe > cmd.exe > powershell.exe and a negative community score on 34.104.35.123. Not enough to work with.
As I worked through the plugins and reasoning, I felt that the output was giving me diminishing returns. The effort was high for not much pay off. We need to change the angle at which we approach this.
The next step requires some lateral thinking. We know from the .dmp extension that this is a Windows crash dump rather than a raw memory image, which matters because user space memory can be paged out in crash dumps to save space. That sounds like a limitation, but the fact that pslist, cmdline and netscan all returned real data is actually a good sign — it suggests this is either a full dump or at minimum a kernel dump, meaning it can contain Windows event logs.
That opens up a useful lead. Given that the scenario points to removable devices as the likely infection vector, the logical next step is to look for event logs embedded in the dump and carve them out for analysis.
Getting Log Files
Manually Looking for Log Files
File Scan & sls
We first have to run filescan.
We will output this to windows.filescan.out so we can run some sls queries on it.

Creating the windows.filescan.out file
Notice that we also have to set the PYTHONIOENCODING to utf-8.
This was done because some filenames contain characters that the default PowerShell console encoding cannot represent.
Setting the encoding to utf-8 allows us to write the output to a file and sls it.
Now all we have to do is search for evtx which is the file extension for Windows event logs.
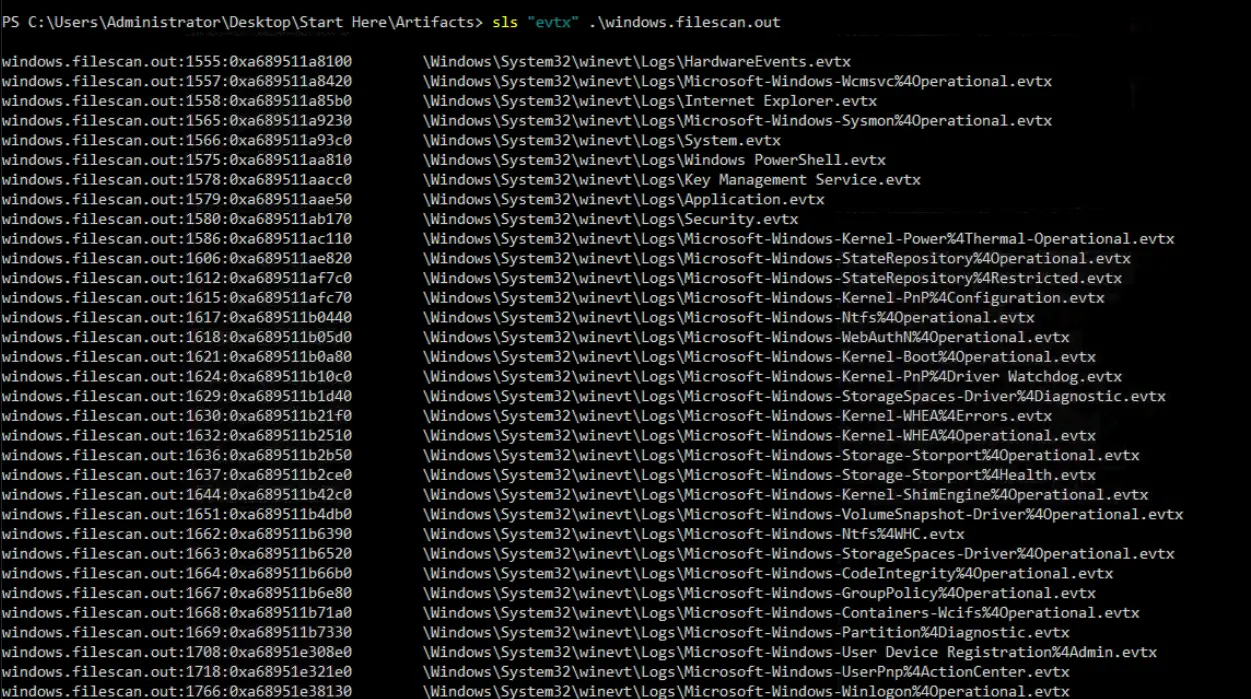
evtx logs found in windows.filescan.out
Fortunately, we managed to output a large list of Windows event logs. Now we need to know what logs we are looking for. For this I just searched Google for what Windows event logs are relevant to removable storage devices which gives me the list
Microsoft-Windows-DriverFrameworks-UserMode%4Operational.evtx(Tracks connections and disconnections via Event IDs 2003, 2100, 2101, 2102)System.evtx(Logs Plug and Play driver installations via Event IDs 20001, 20003, 20005)Microsoft-Windows-Partition%4Diagnostic.evtx(Reveals capacity, manufacturer, model, and Volume Serial Number via Event ID 1006)Security.evtx(Records file reads, writes, and deletions if “Audit Removable Storage” policy is active via Event IDs 4656, 4663, 4658)Microsoft-Windows-Storage-ClassPnP/Operational.evtx(Logs low-level storage driver and device detection issues)Microsoft-Windows-Ntfs/Operational.evtx(Captures file system mounting actions)
Let’s check if any of these are present by using
sls ".evtx" .\windows.filescan.out | sls 'System\.evtx|Microsoft-Windows-DriverFrameworks.*\.evtx|Partition\%4Diagnostic\.evtx|\\Security\.evtx|Microsoft-Windows-Ntfs|Microsoft-Windows-Storage-ClassPnP'

Checking what logs are present
We can see that the majority of the logs are present except for Microsoft-Windows-DriverFrameworks-UserMode%4Operational.evtx.
Let’s carve these files out.
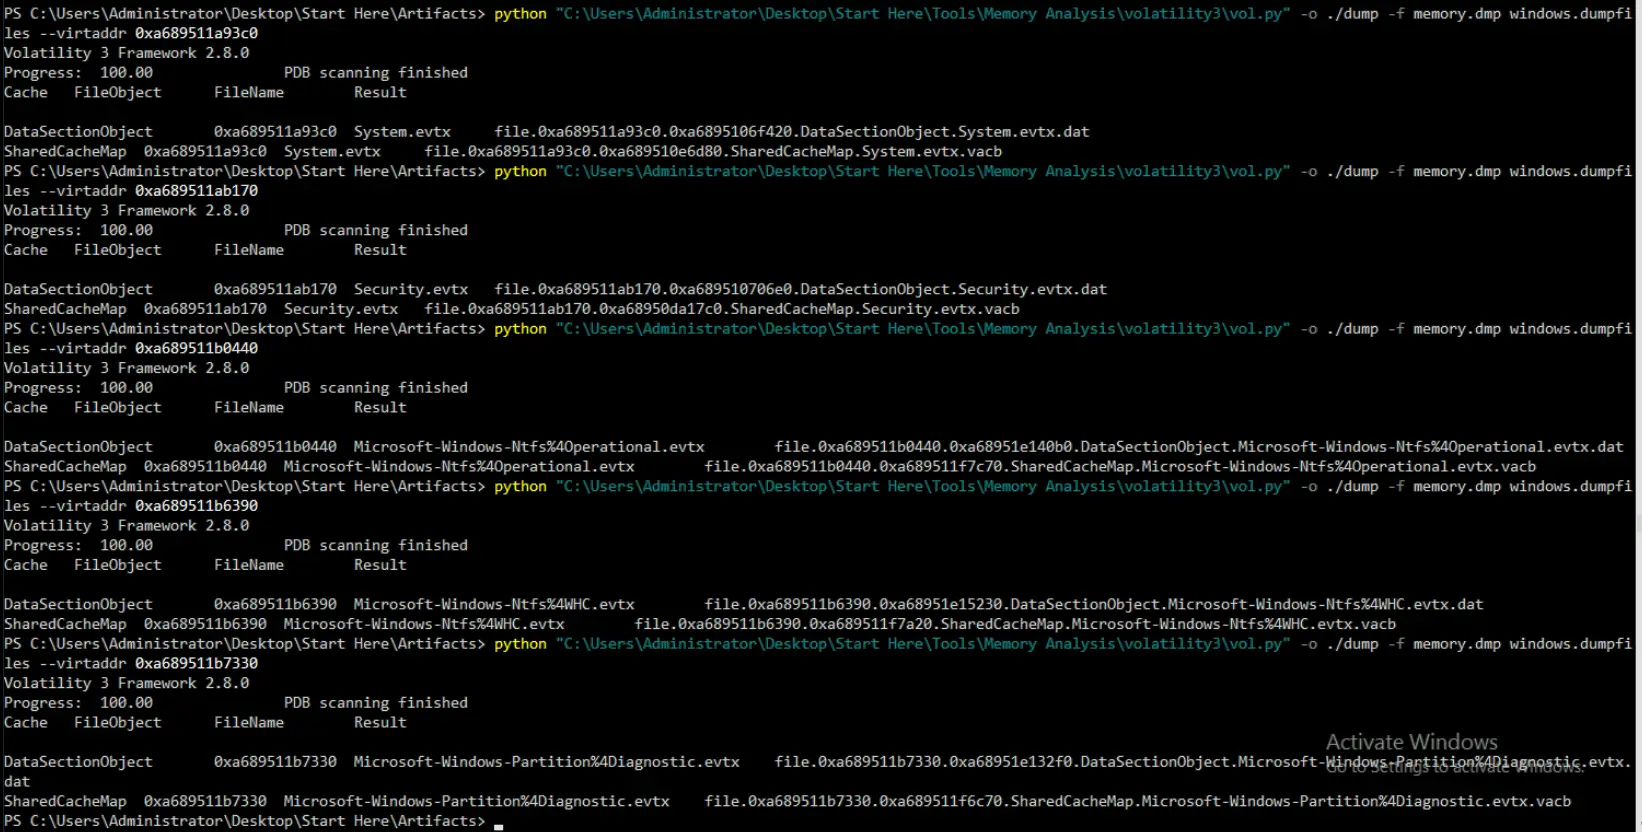

Carving files out
Notice how two file types are carved out for each log file.
One is vacb and one is dat.
An easy way of telling which one we want to look at for this use case is really just the size of the file.
For instance we can see that the vacb file is larger than the dat file for Security.evtx.
Therefore, we want to be analyzing the vacb files.

File size difference
Parsing the Log Files Using EvtxECmd.exe
We can now pass these files to EvtxECmd.exe to have them parsed.
However, we should first rename the vacb files to have extension .evtx as well as just a much shorter filename.
So we have something like this.

Shorter filenames and correct extensions
Now we pass these files to EvtxECmd.exe.
Using the Microsoft-Windows-Ntfs-Operational.evtx as an example we use the command
&"C:\Users\Administrator\Desktop\Start Here\Tools\ZimmermanTools\net6\EvtxeCmd\EvtxECmd.exe" -f .\Microsoft-Windows-Ntfs-Operational.evtx --csv . --csvf microsoft-windows-ntfs-operational-parsed.csv
Which then gives us the following output
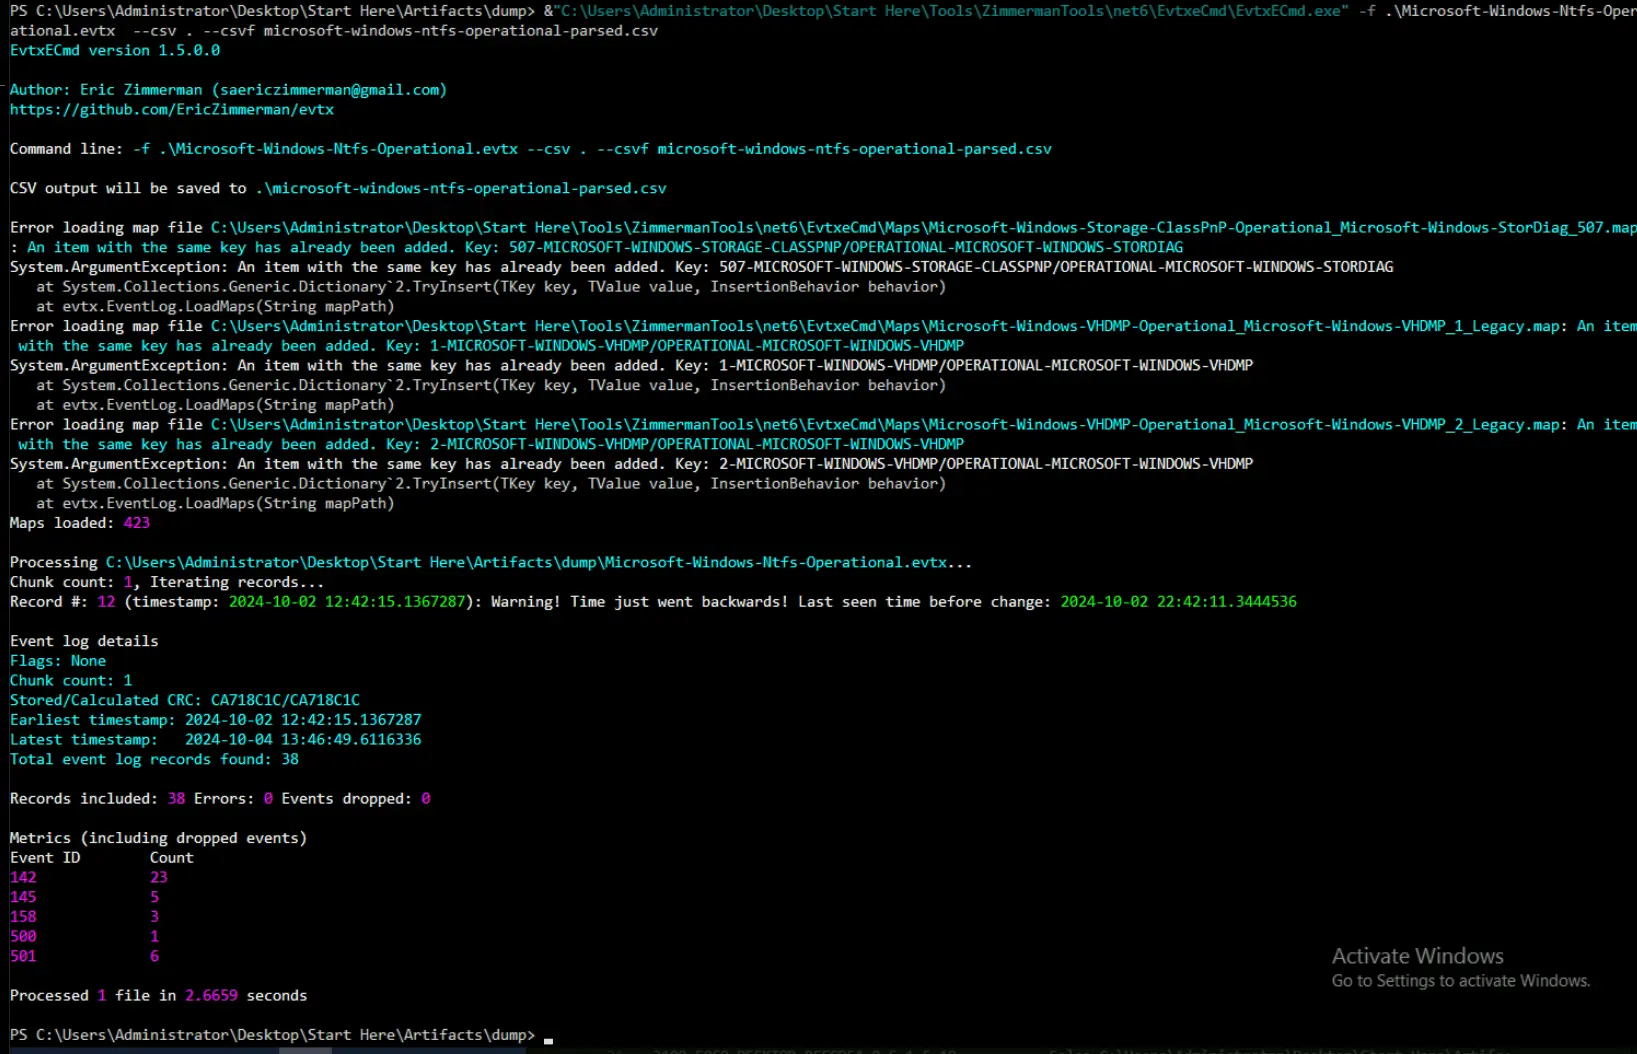
Output of parsing tool
as well as the csv file with all the data
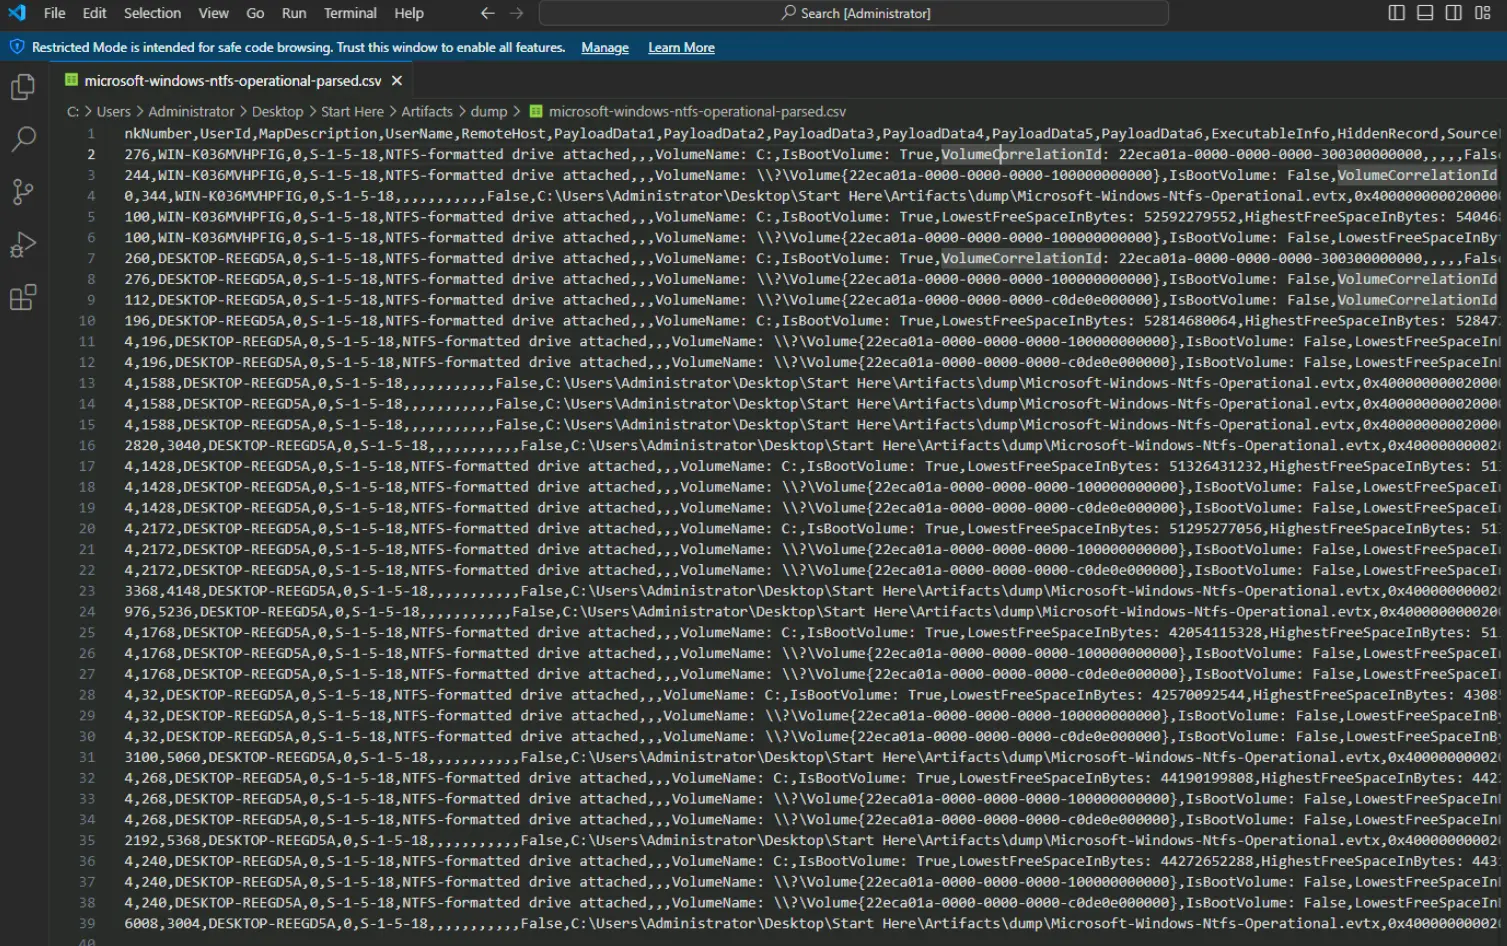
Exported csv
We can also just drag and drop the evtx files into ELEX to open them.
As shown below,
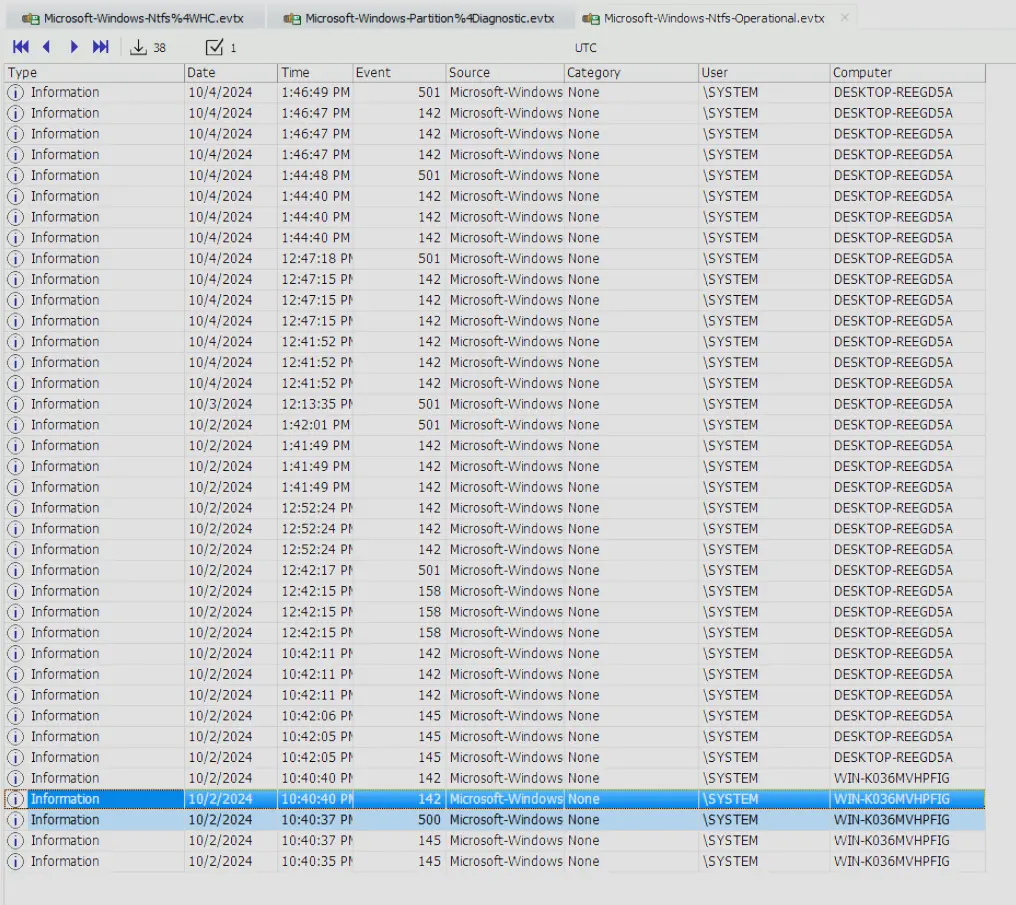
ELEX output
Automatically Getting Log Files & More (MemProcFS)
As evident from the manual analysis of logs.
It is a highly involved process just to extract 1 set of logs.
Luckily, we have a tool that allows us to do all this automatically (and more) which is MemProcFS.
To get started we pass the memory.dmp to MemProcFS through the following command,
&"C:\Users\Administrator\Desktop\Start Here\Tools\Memory Analysis\MemProcFS\memprocfs.exe" -device .\memory.dmp -mount M -forensic 3 -license-accept-elastic-license-2-0
This command means mount memory.dmp as files in virtual file system, mount it as drive M, set forensic mode 3 and also accept the elastic-license-2-0 which enables the YARA scanning against the built in ruleset.
It is important to note the argument -forensic 3 is here because this instructs MemProcFS to perform a batch-oriented analysis pass on top of the standard memory analysis. It will read the complete memory sequentially and perform multiple analysis tasks in parallel, the results of which are saved to a SQLite database. The omission of this argument means we have to manually perform the analysis ourselves.
The number after forensic just determines the persistence of the SQLite database holding the results. As shown below,
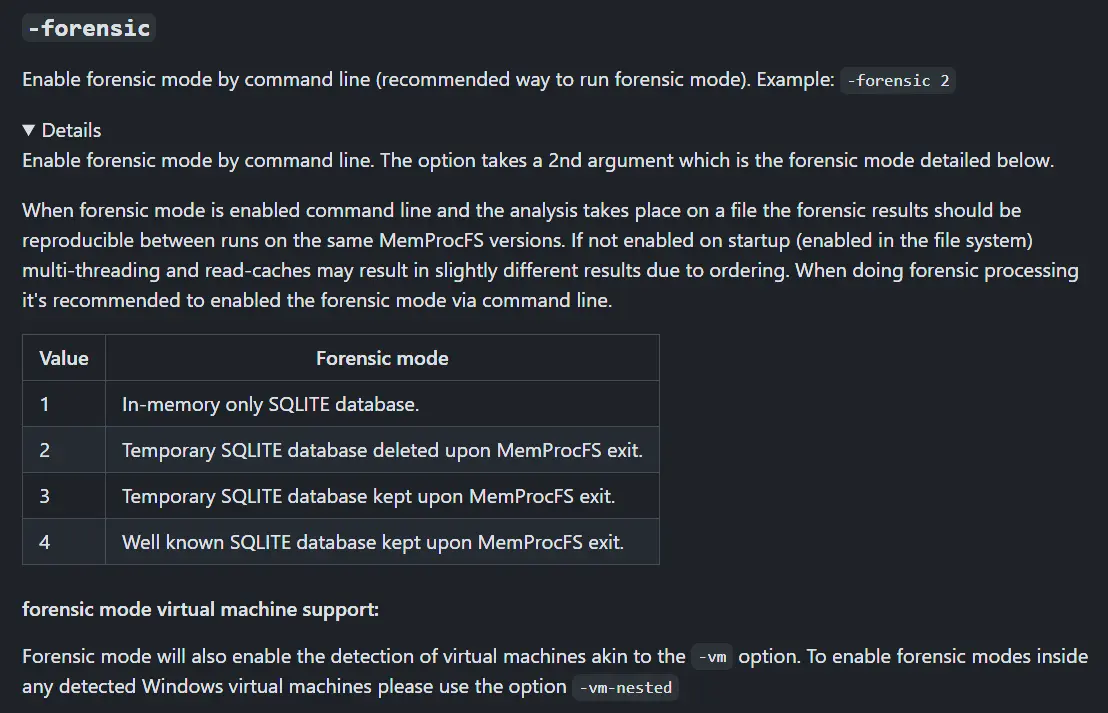
Wiki page from official MemProcFS GitHub repo (_CommandLine · ufrisk/MemProcFS Wiki)
That’s great but what does this mean for us as analysts. It means that a lot of the forensic heavy lifting will be done by the program and we can just browse the results in the mounted drive. Saving us time and effort.
Running the command will yield us the following,
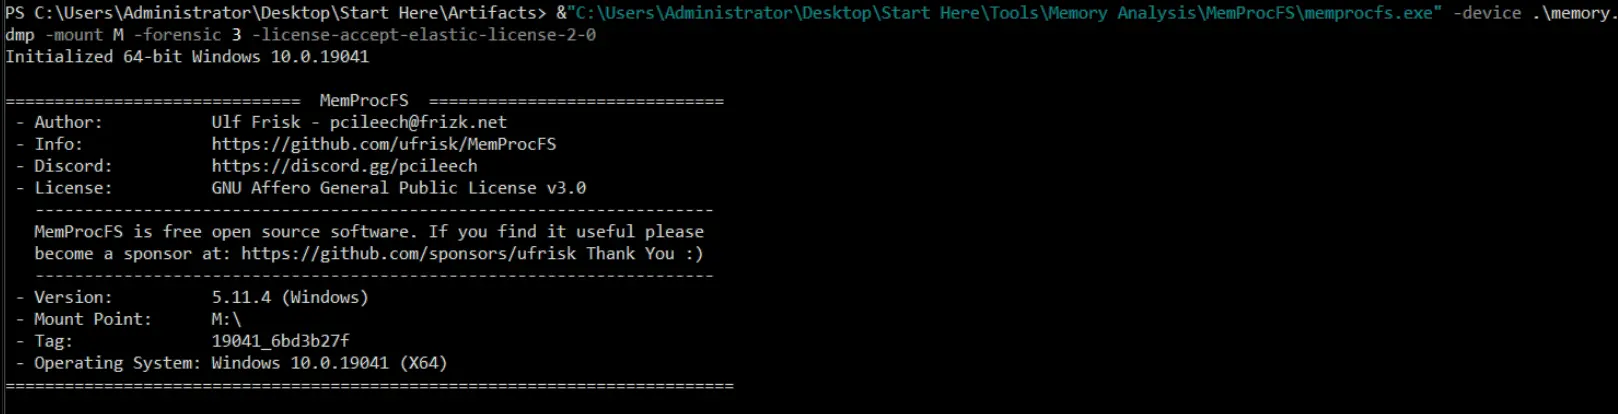
Command output
And in the file explorer, the mounted drive as seen below,
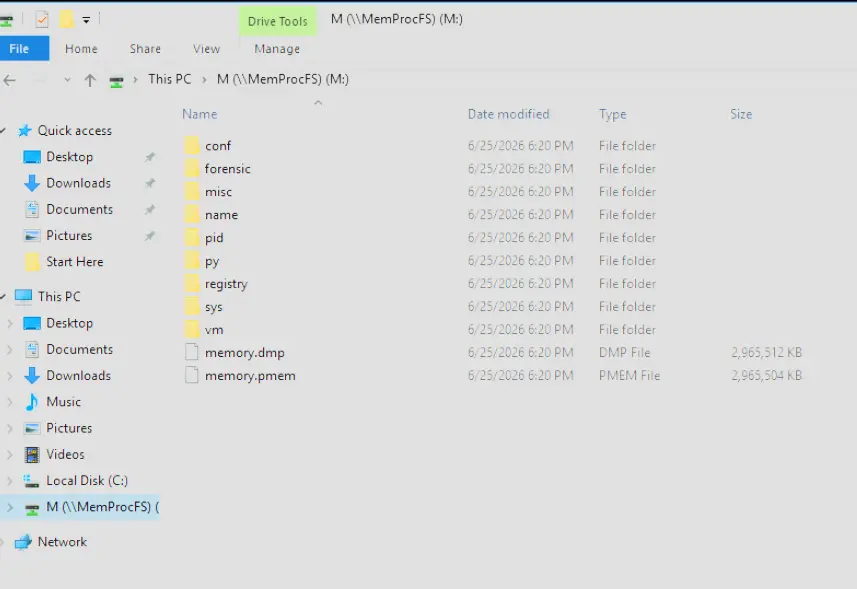
Mounted drive
If we click into M:\forensic too early, the forensic analysis may have not yet completed.
Therefore, we will not be able to view the results yet.
To check on the progress we can do a simple PowerShell script that just checks M:\forensic\progress_percent.txt.
while ($true) { Get-Content "M:\forensic\progress_percent.txt"; Start-Sleep 3}
Which gives us something like this
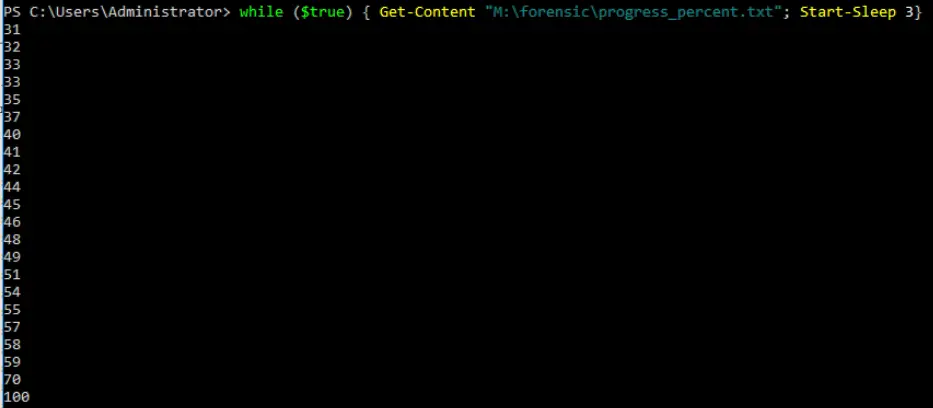
Checking progress
Once it reaches 100, we just Ctrl+C the program and view the results.
With this we can now answer the questions in the lab.
Questions
Q1 — Serial Number of USB Device
Tracking the serial number of the USB device is essential for identifying potentially unauthorized devices used in the incident, helping to trace their origin and narrow down your investigation. What is the serial number of the inserted USB device?
Approach: Navigate to M:\py\reg\usb\usb_storage in the MemProcFS virtual filesystem to read USB device metadata from the registry plugin output.
In our MemProcFS mounted virtual file system is the directory M:\py.
This folder contains the output of the various Python plugins that MemProcFS uses.
If we look at the MemProcFS GitHub and check under files/plugins we will see one of the Python scripts is pyp_reg_root_reg$usb_usb$storage.py.
Which if we look at quickly actually gives us the serial number of USB storage devices. Below, is the source code for the script.
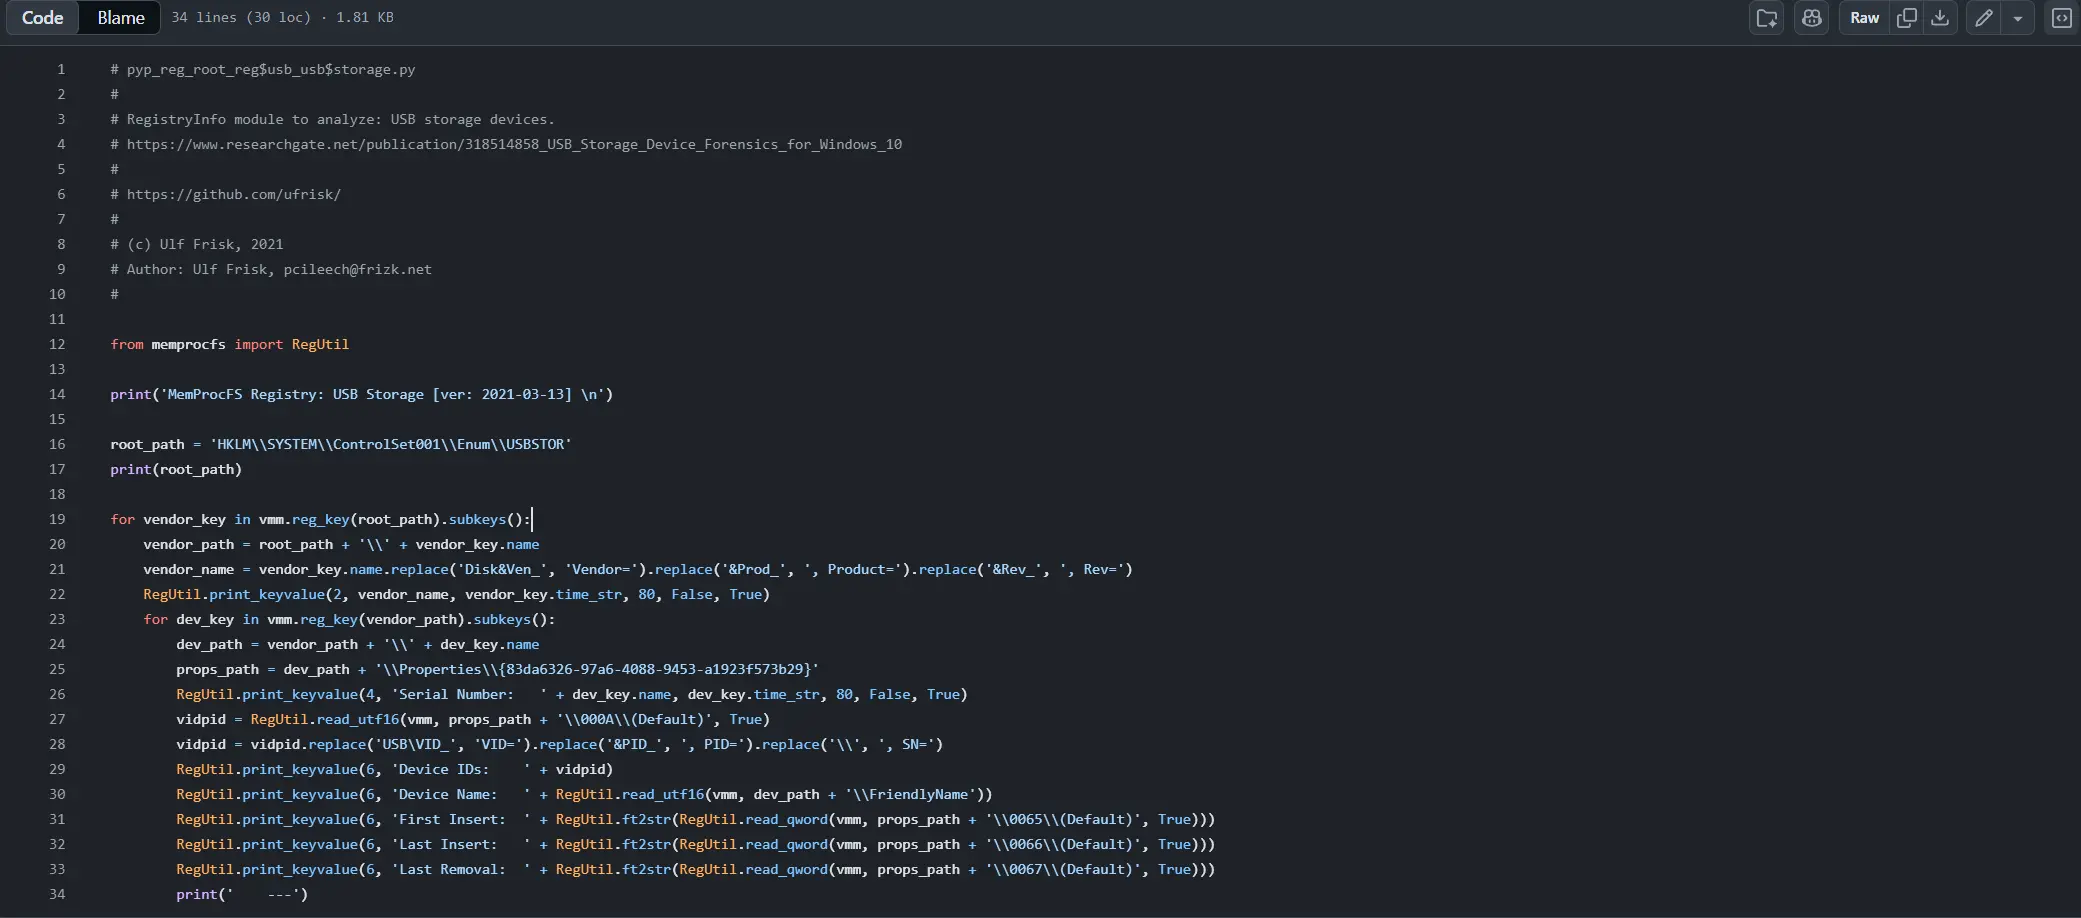
Source for usb_storage script (pyp_reg_root_reg$usb_usb$storage.py · ufrisk/MemProcFS)
Let’s look into this folder and see what we can find.
If we navigate into M:\py\reg\usb we will find two files which are usb_devices and usb_storage.
The one we care about is usb_storage and it tells us the serial number of the USB device is 7095411056659025437&0
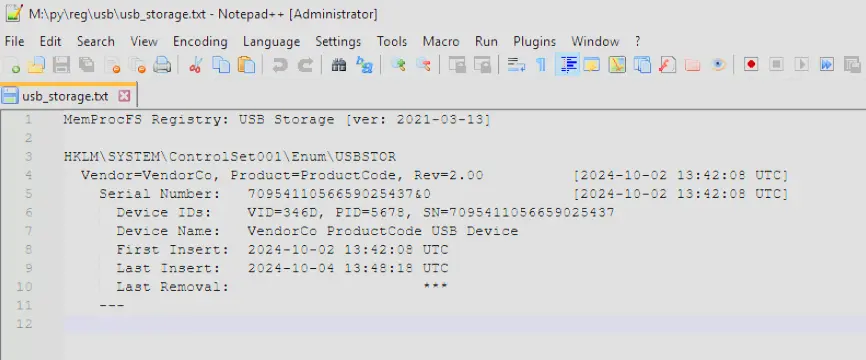
usb_storage.txt
Answer: 7095411056659025437&0
Q2 — Last USB Insertion Time
Tracking USB device activity is essential for building an incident timeline, providing a starting point for your analysis. When was the last recorded time the USB was inserted into the system?
We can see this in usb_storage.txt under Last Insert.
The last insert time was 2024-10-04 13:48:18 UTC.
Answer: 2024-10-04 13:48:18 UTC
Q3 — Full Path of Malware Executable
Identifying the full path of the executable provides crucial evidence for tracing the attack’s origin and understanding how the malware was deployed. What is the full path of the executable that was run after the PowerShell commands disabled Windows Defender protections?
Approach: Copy event logs from M:\misc\eventlog to disk, parse the whole directory with EvtxECmd into a single CSV, load into Timeline Explorer, and search for cmd.exe to surface the PowerShell execution command line.
For this we need to look at the Windows event logs which we will find in M:\misc\eventlog.
To analyze the Windows event logs, navigate to M:\misc\eventlog in MemProcFS. However, these files cannot be opened and analyzed directly as they are virtual files reconstructed from memory on the fly by MemProcFS, meaning they are not stable files on disk.
Since M: is a virtual filesystem, we first need to copy the logs to a real location on disk before any analysis tool can read them properly. Simply copy the contents of M:\misc\eventlog and paste them into a working directory of your choice as long as it points to a real on-disk location. Once copied, the files become stable and can be opened with any standard analysis tool.
I chose C:\Users\Administrator\Desktop\Start Here\Artifacts\logs as my working directory.
Going through each one of these evtx files or finding out which log file in particular is of interest can be tedious.
So what we can do instead is use EvtxECmd.exe to retrieve all the data from the log files and dump it all into one csv.
From there we can just search key terms in the csv through Timeline Explorer’s search bar.
This command invokes EvtxECmd.exe, specifies the directory where our logs reside to recurse over, specifies the output directory for the resulting csv file as well as define the file name.
&'C:\Users\Administrator\Desktop\Start Here\Tools\ZimmermanTools\net6\EvtxeCmd\EvtxECmd.exe' -d .\logs\ --csv . --csvf results.csv
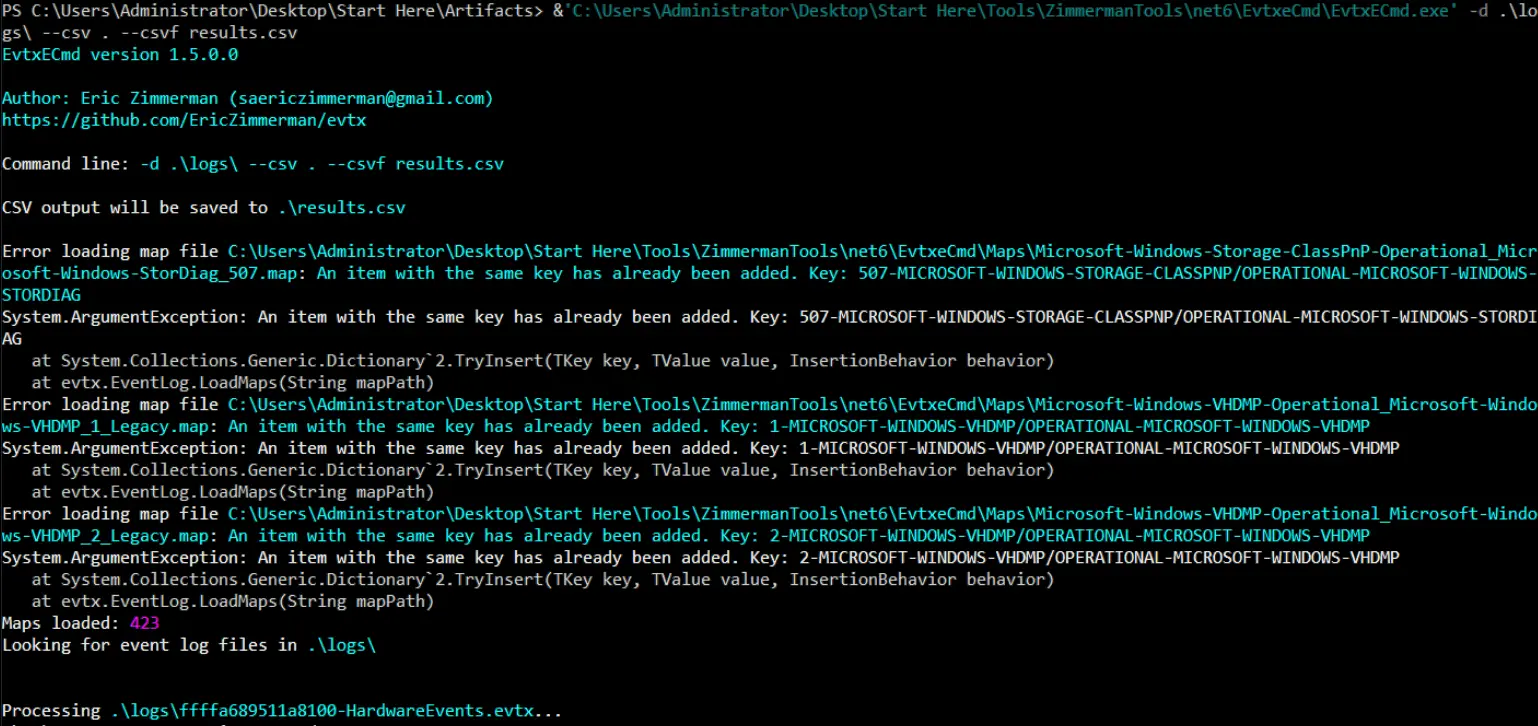
Snippet of EvtxECmd.exe output
We can then just drag and drop this into Timeline Explorer which gives us the following,
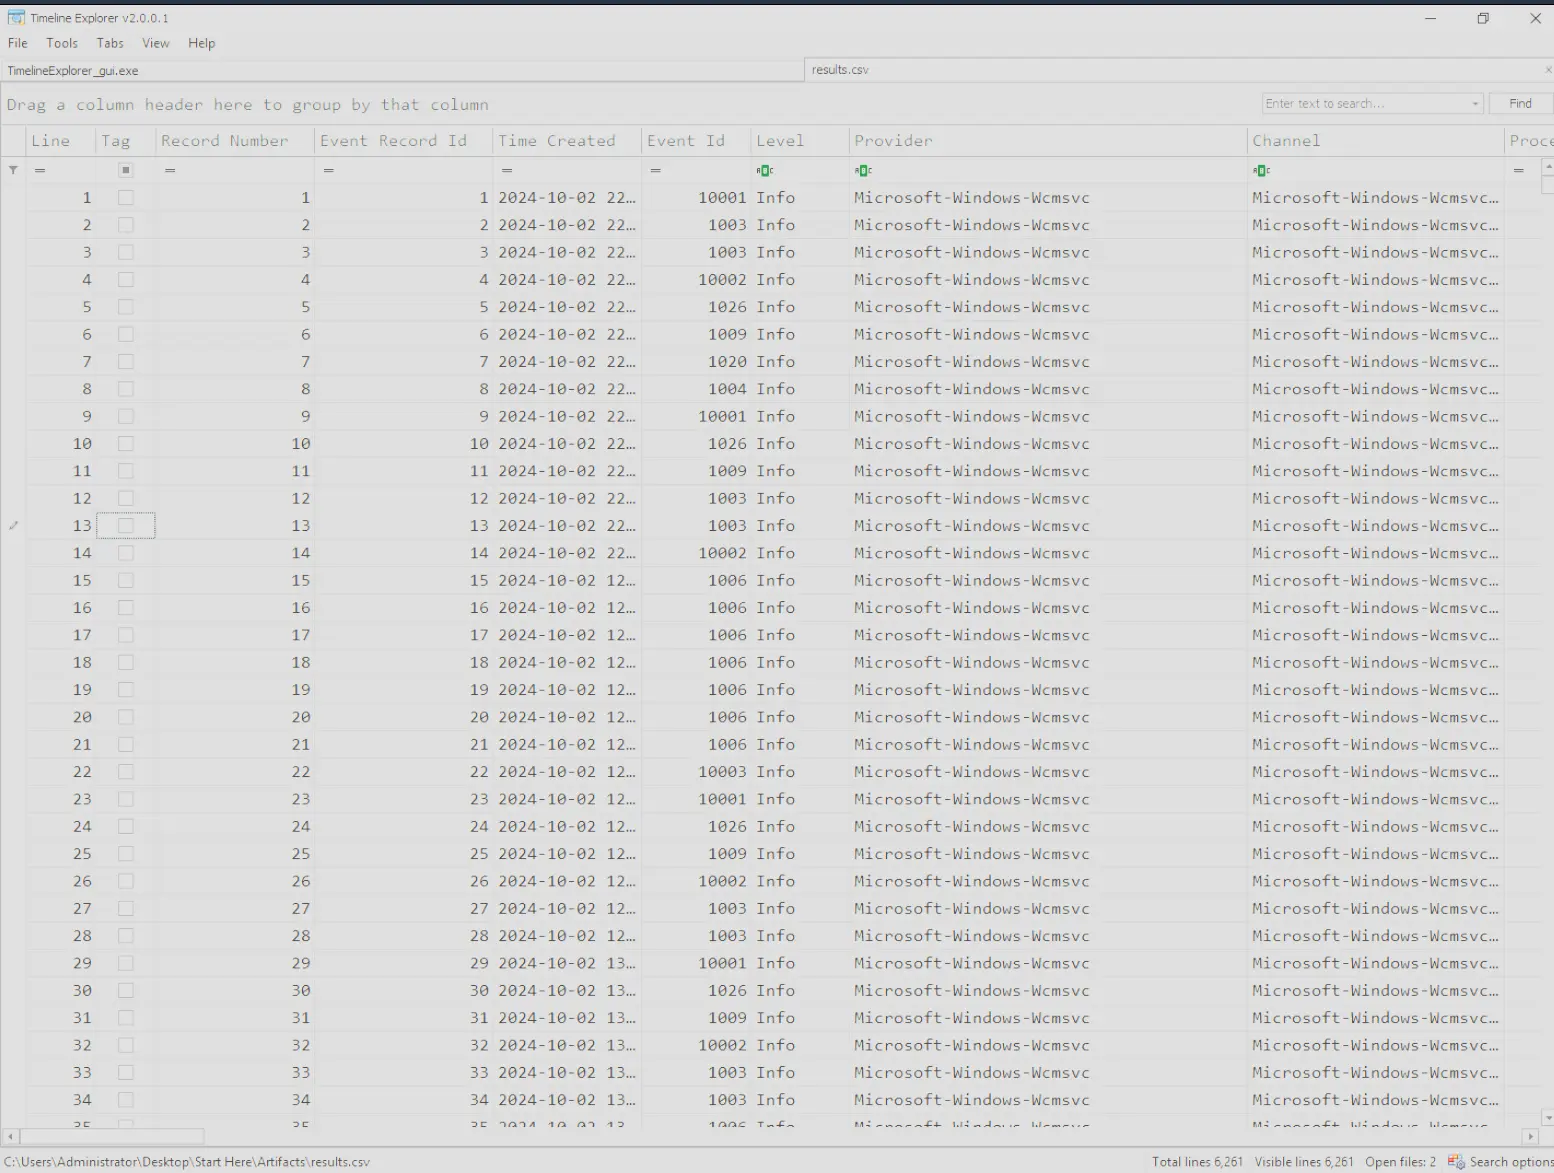
results.csv loaded into Timeline Explorer
With now a complete view of all Windows logs we can search for key terms in the logs.
We found out in our initial triage that there was a suspicious chain of processes specifically explorer.exe > cmd.exe > powershell.exe.
This could imply that powershell.exe was invoked using cmd.exe.
Let’s try searching for cmd.exe.

Timeline Explorer output
We can see that two logs are found with the following details
- Map Description:
Process creation - User Name:
DESKTOP-REEGD5A\Tomy
Now if we look at Executable info we will see that these logs show the command cmd.exe was invoked with and the child powershell.exe process it spawned.
Let’s look at the command that invoked cmd.exe.
"C:\Windows\System32\cmd.exe" /c powershell.exe -ExecutionPolicy Bypass -Command "Set-MpPreference -DisableRealtimeMonitoring $true; Set-MpPreference -DisableBehaviorMonitoring $true; Set-MpPreference -DisableIOAVProtection $true; Set-MpPreference -DisableScriptScanning $true; Set-MpPreference -DisableBlockAtFirstSeen $true; Set-MpPreference -DisableCloudProtection $true; Set-MpPreference -DisableArchiveScanning $true; Set-MpPreference -SubmitSamplesConsent 2; sc stop WinDefend; sc config WinDefend start= disabled; sc stop SecurityHealthService; sc config SecurityHealthService start= disabled; Start-Process 'E:\hidden\Trusted Installer.exe'"
This command means use cmd.exe to invoke powershell.exe with the following arguments then exit immediately after (/c argument).
This explains why we saw the processes in the pslist but not the corresponding cmdline record to show with what arguments they were invoked with. The cmdline field in Volatility 3 comes from the process PEB which only exists when the process is alive.
The author used cmd.exe as purely a launcher.
He used PowerShell to disable Microsoft Defender and start the malware at path E:\hidden\Trusted Installer.exe.
Answer: E:\hidden\Trusted Installer.exe
Q4 — URL for C2 File
Identifying the bot malware’s C&C infrastructure is key for detecting IOCs. According to threat intelligence reports, what URL does the bot use to download its C&C file?
Approach: Search Timeline Explorer for Trusted Installer to surface the process creation event and extract its MD5 hash, then look it up on VirusTotal under Behaviour > MITRE ATT&CK > Command and Control.
Having found the name of the malicious executable, we can search through the logs to see how it interacted with the system.
Our main goal is to determine what URL the bot uses to download its C2 file.
Furthermore, the question specifically states threat intelligence reports so let’s try finding something like a file hash that can be passed to platforms like VirusTotal.
First we just search Trusted Installer which gets us the following logs,
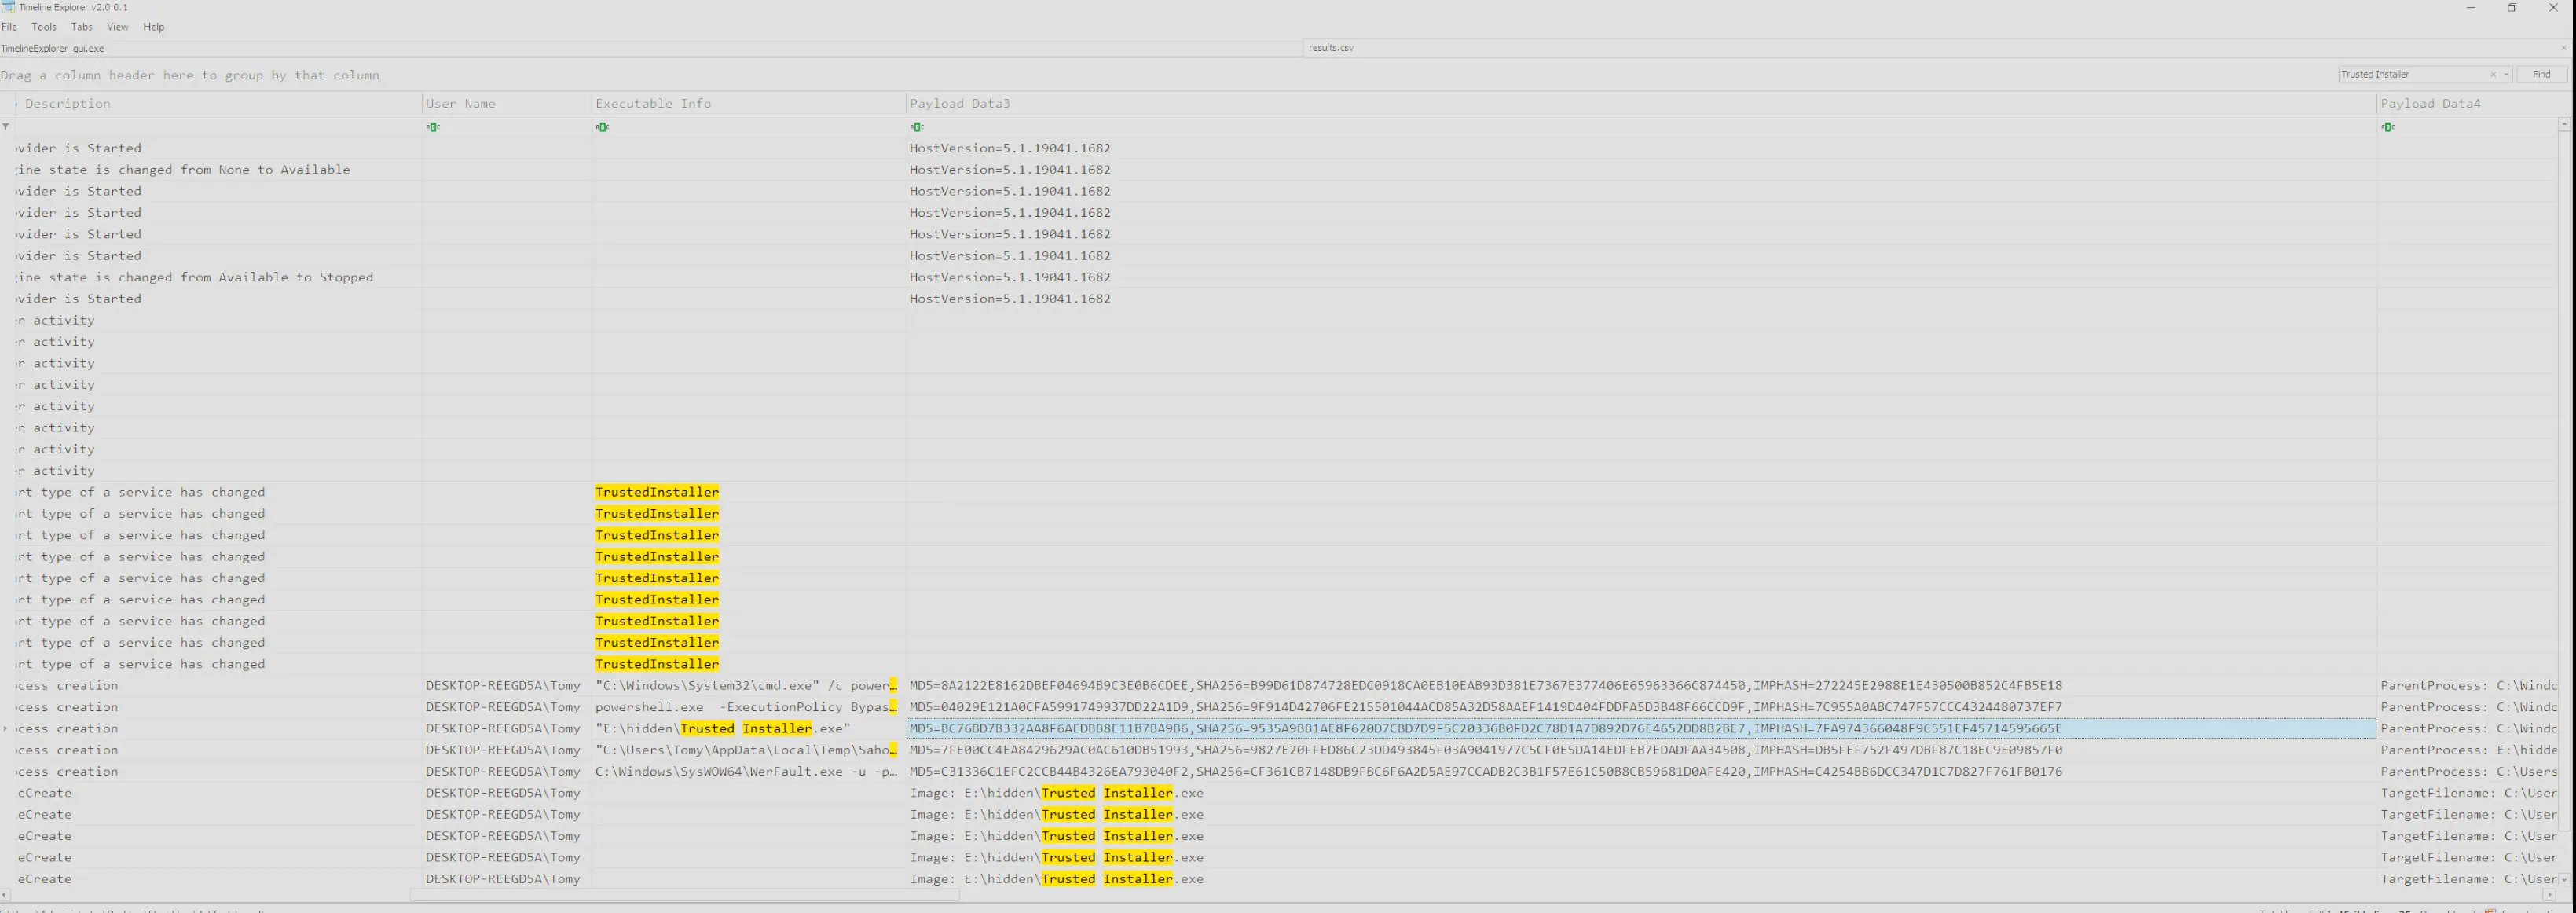
Output of search
We can see from the output that we have an MD5 hash of the created process from E:\hidden\Trusted Installer.exe.
Let’s grab the MD5 hash which is BC76BD7B332AA8F6AEDBB8E11B7BA9B6 then pass it to VirusTotal as seen below,
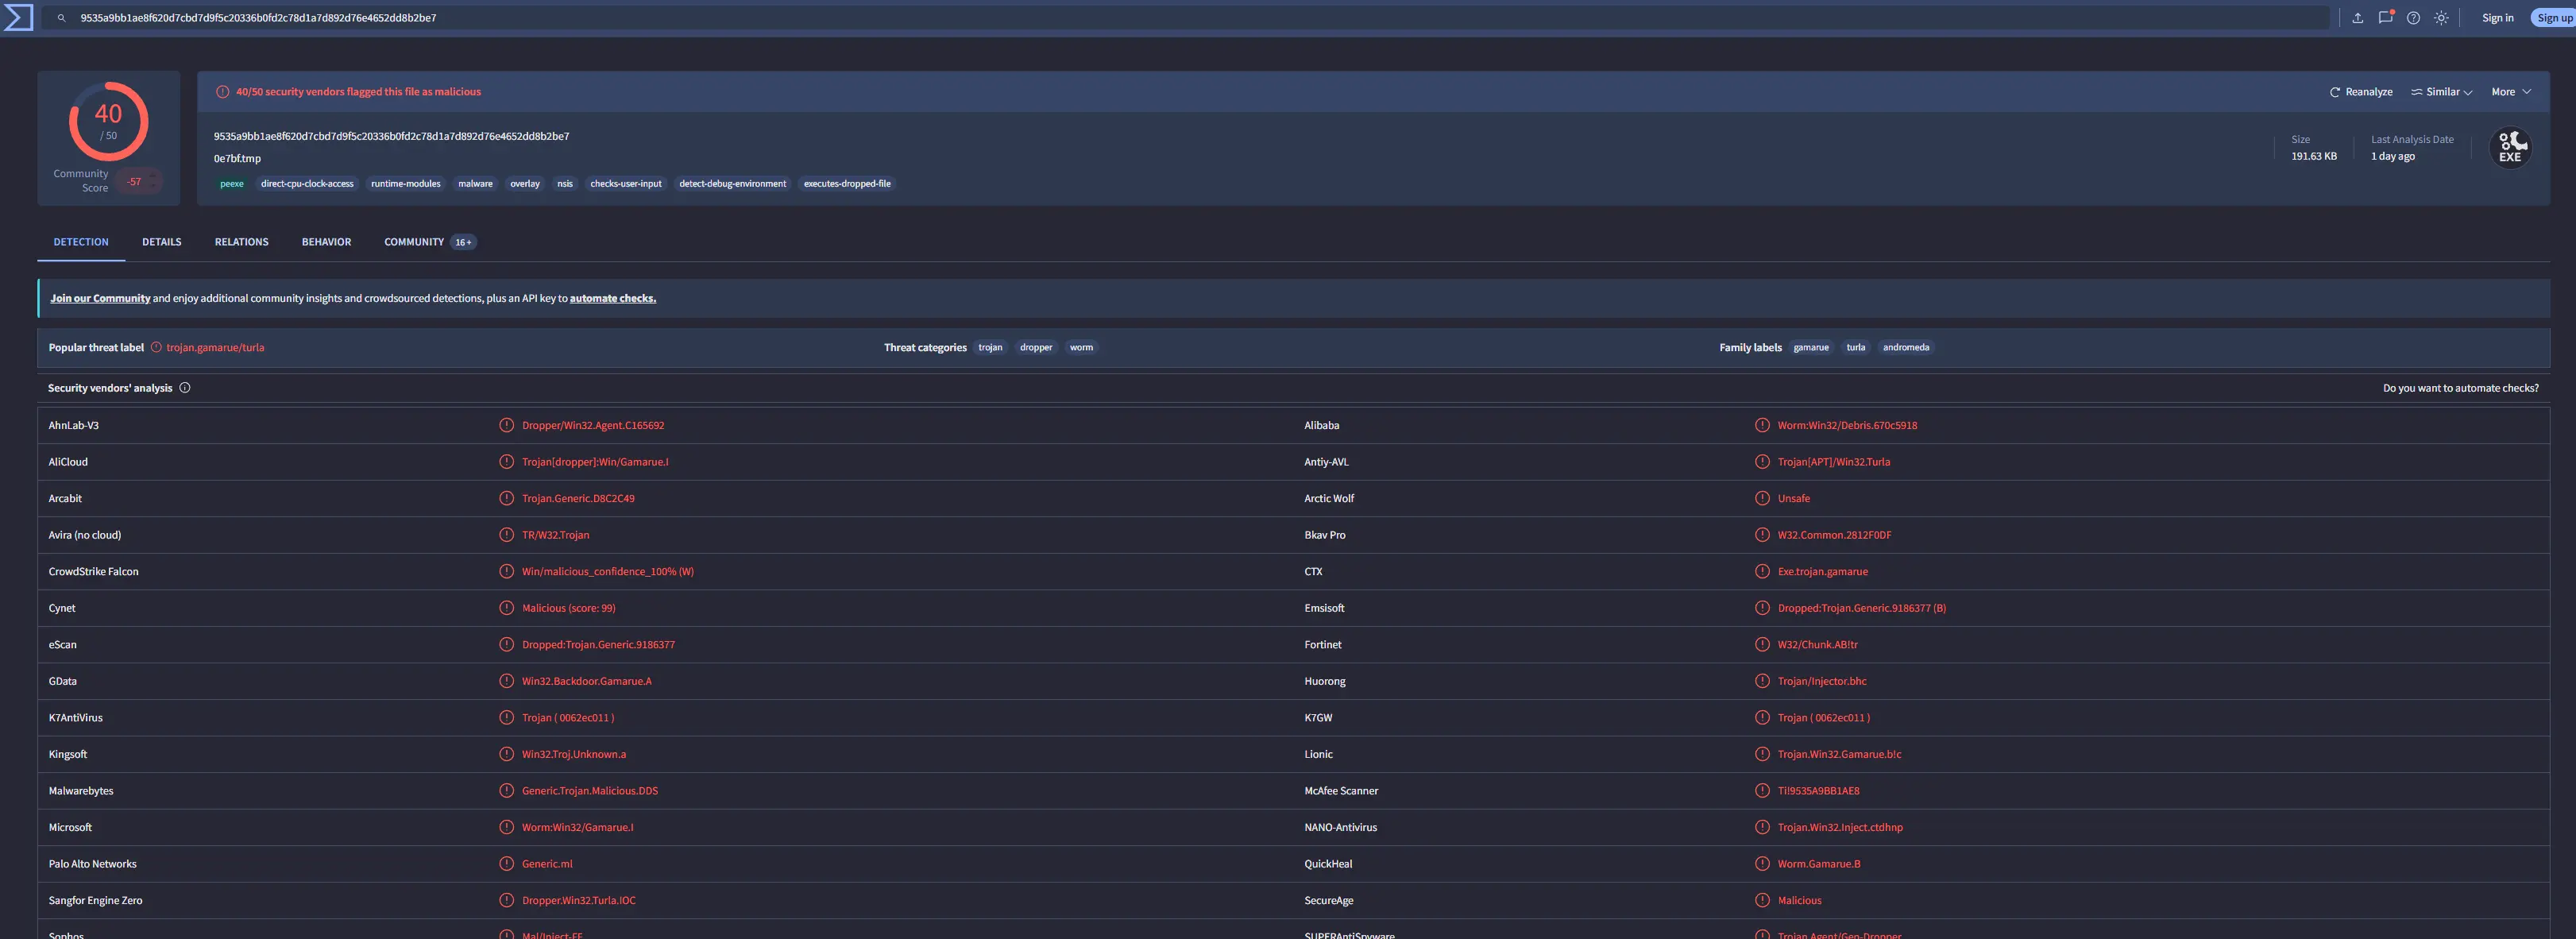
Threat intelligence report of malware on VirusTotal
As you can see, most security vendors have flagged this executable as malicious.
If we go under Behaviour then go to MITRE ATT&CK Tactics and Techniques, we will see a column for Command and Control.
In this column, is a clickable element labelled Ingress Tool Transfer which tells us that the malware downloads a file via http://anam0rph.su/in.php.
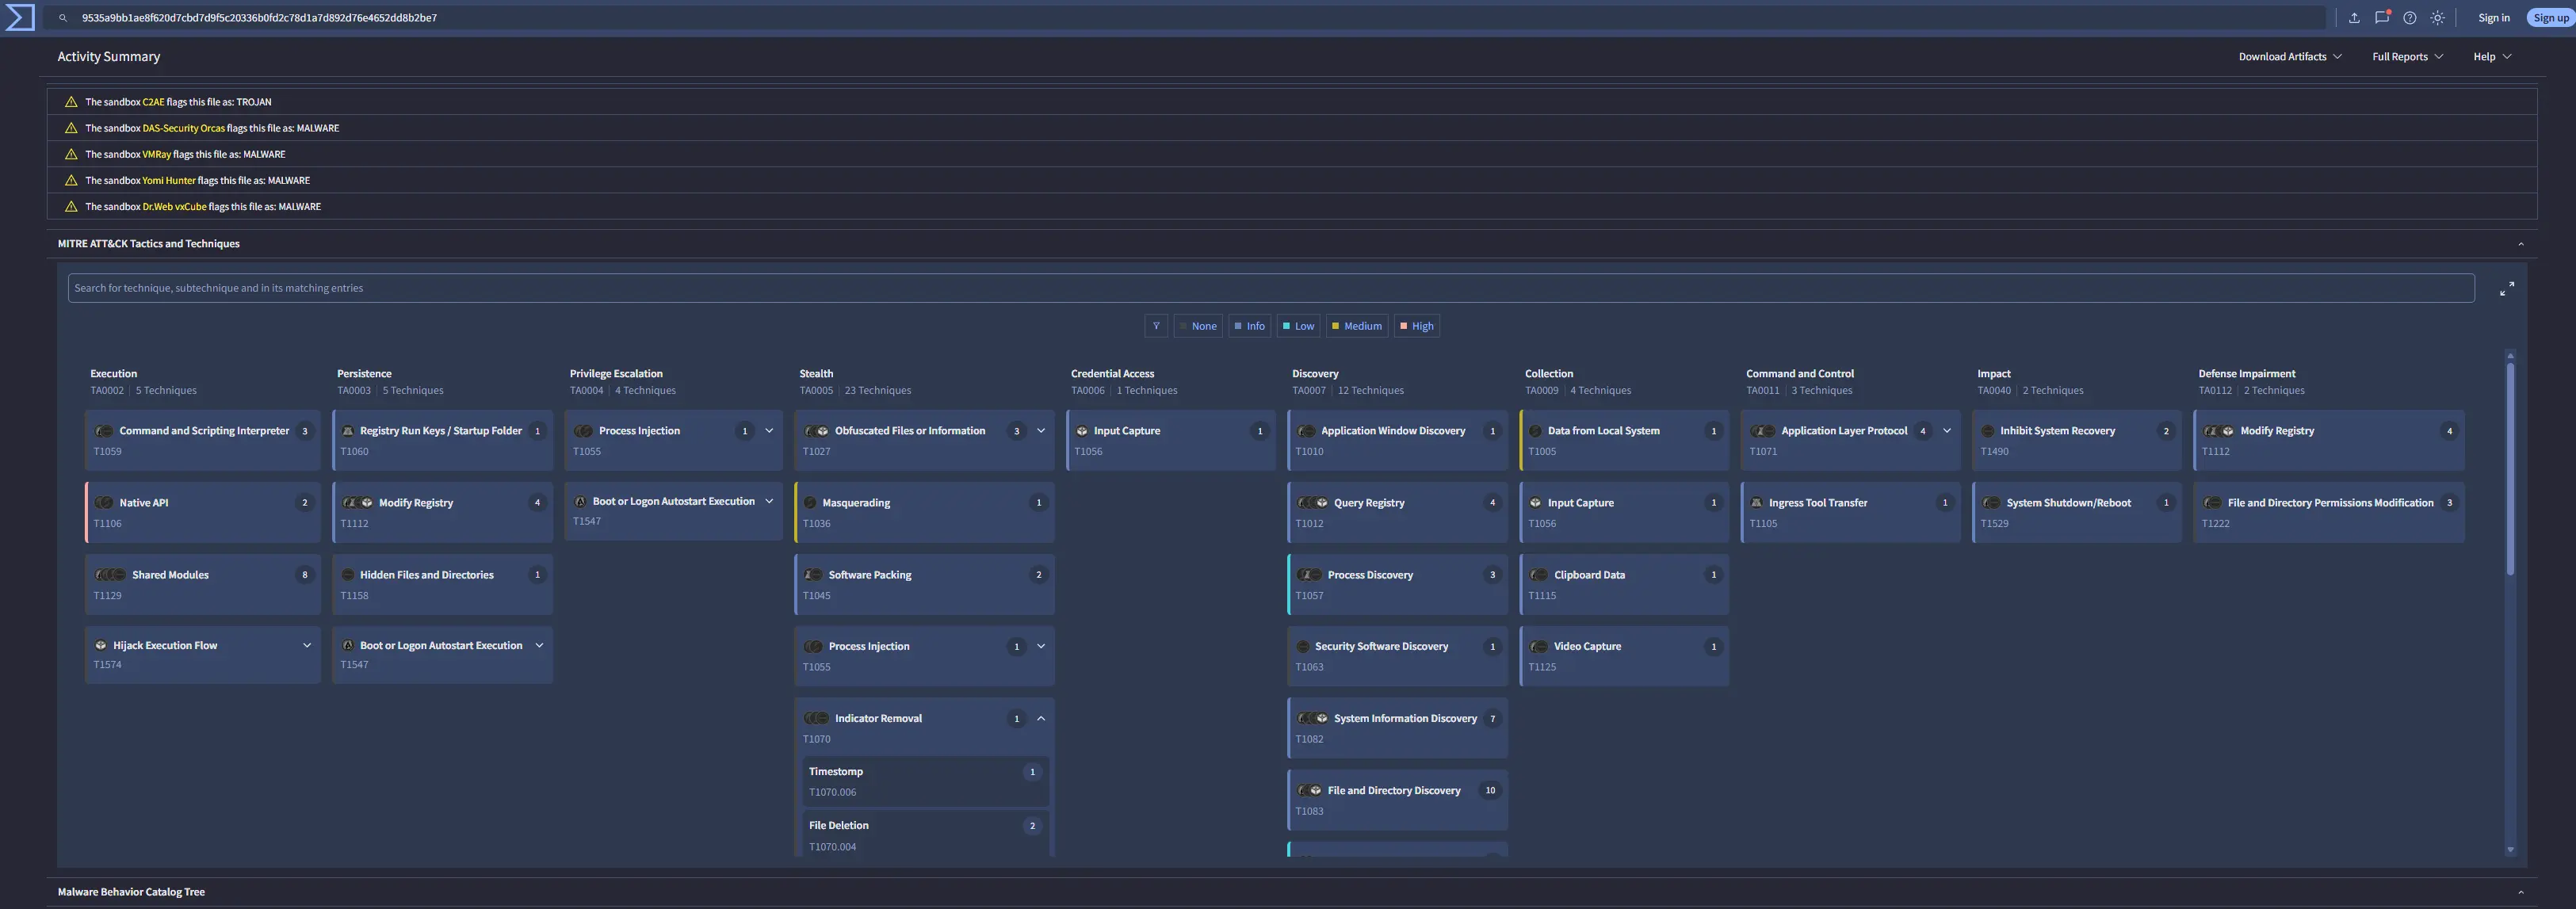
Behaviors page
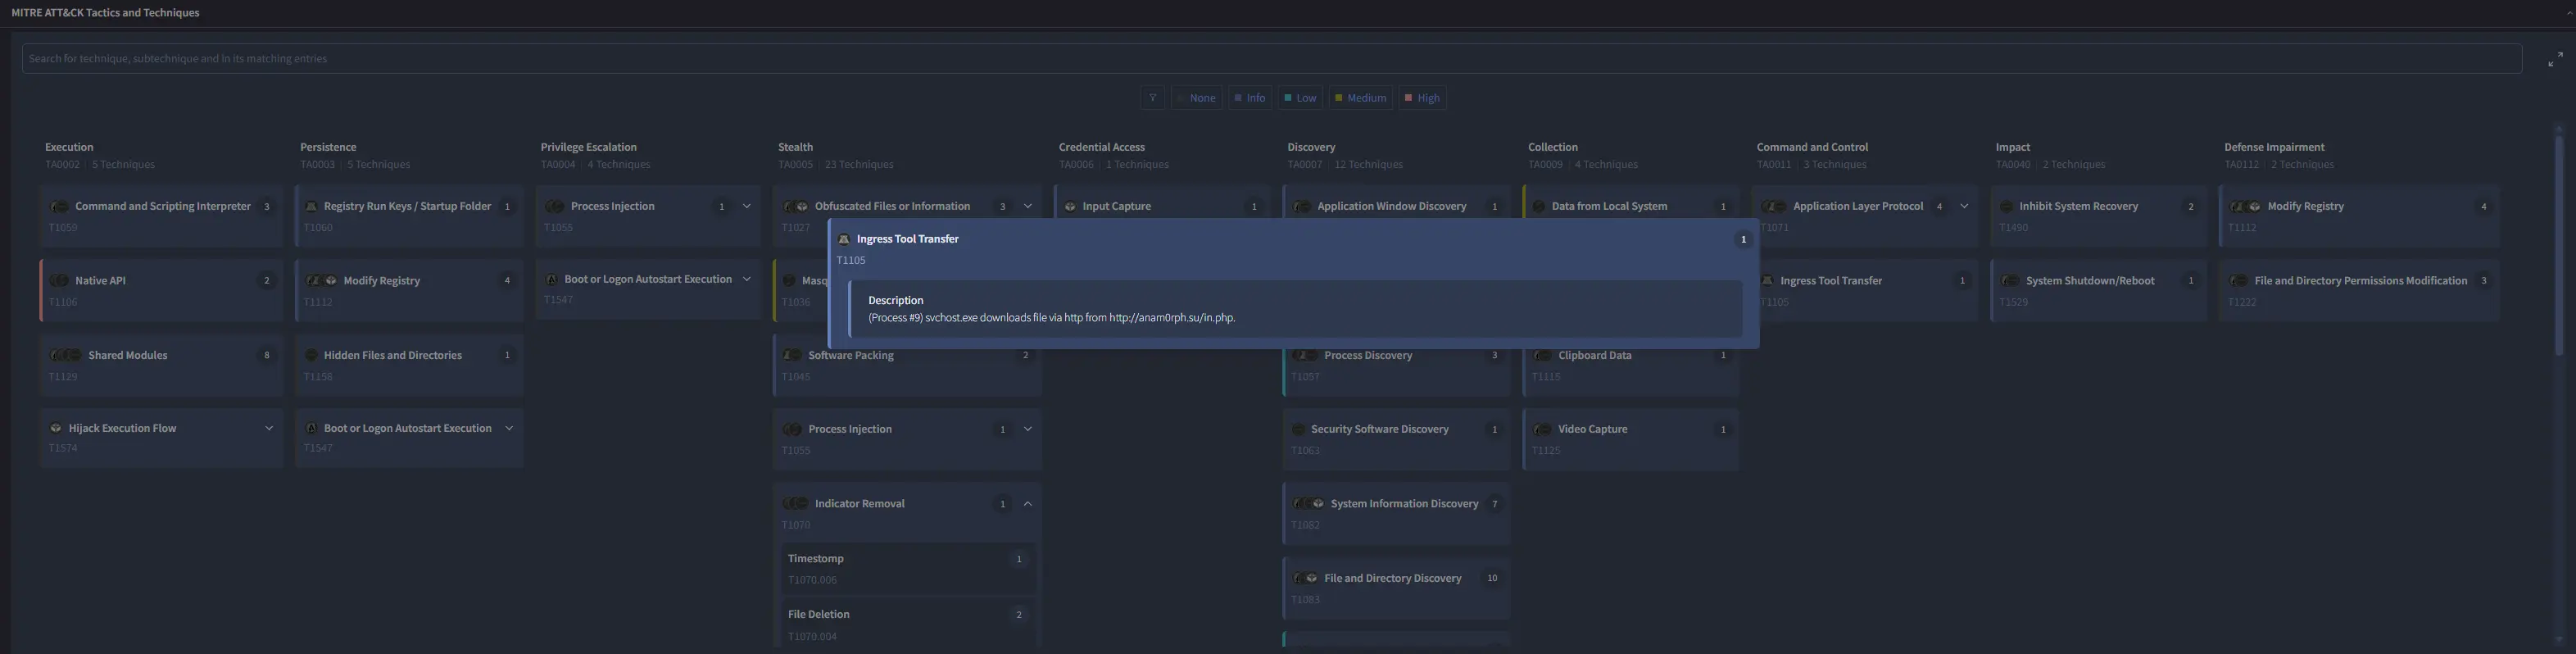
Ingress Tool Transfer
Answer: http://anam0rph.su/in.php
Q5 — MD5 Hash of Dropped Executable
Understanding the IOCs for files dropped by malware is essential for gaining insights into the various stages of the malware and its execution flow. What is the MD5 hash of the dropped .exe file?
Approach: Return to the Timeline Explorer search for Trusted Installer, sort records by time ascending to reveal file creation events, then search for the dropped executable name to retrieve its MD5 hash.
If we go back to our Timeline Explorer output after searching Trusted Installer and sort the records by time ascending.
We will see the following,

File create records
Therefore, the malware drops multiple DLLs as well as an executable C:\Users\Tomy\AppData\Local\Temp\Sahofivizu.exe.
Finding the MD5 hash for this is easy as we now have the actual file name.
We just search Sahofivizu.exe then find the following record,

Finding Sahofivizu.exe event logs
Which gives us the MD5 hash 7FE00CC4EA8429629AC0AC610DB51993.
Answer: 7FE00CC4EA8429629AC0AC610DB51993
Q6 — Full Path of First Dropped DLL
Having the full file paths allows for a more complete cleanup, ensuring that all malicious components are identified and removed from the impacted locations. What is the full path of the first DLL dropped by the malware sample?
We have already seen this in the previous question in the file create records output.
Since the output was sorted by time ascending, the full path of the first DLL dropped is C:\Users\Tomy\AppData\Local\Temp\Gozekeneka.dll.
Answer: C:\Users\Tomy\AppData\Local\Temp\Gozekeneka.dll
Q7 — APT Group Behind the Campaign
Connecting malware to APT groups is crucial for uncovering an attack’s broader strategy, motivations, and long-term goals. Based on IOCs and threat intelligence reports, which APT group reactivated this malware for use in its campaigns?
Approach: Research the C2 domain anam0rph.su online to find threat intelligence linking it to a known botnet and the APT group that reactivated it.
Recall that the C2 domain contacted by this malware was http://anam0rph.su/in.php.
If we research into this URL we will find that this domain was actually associated with the Andromeda botnet, a commodity malware that was prevalent in the 2010s.
We will also find this threat intelligence blog on Google Cloud — Turla: A Galaxy of Opportunity | Mandiant | Google Cloud Blog — which tells us that the APT group that reactivated this was Turla.
Answer: Turla
Completion
I successfully completed Andromeda Bot - UNC4210 Blue Team Lab at @CyberDefenders! https://cyberdefenders.org/blueteam-ctf-challenges/achievements/francisvil3213/andromeda-bot-unc4210/